


Reducing Audit Events Lag From 1 Hour to 1 Second
Authors: Ajay Srinivas, Mark Bruce
What Are Audit Events?
Audit events are critical to our clients for various reasons—most notably, compliance and troubleshooting. SailPoint’s Identity Security Platform audits all important changes to an identity such as role assignments, password change activities, access requests, and more.
Audit events emitted by many different micro-services within the platform are processed asynchronously by the Audit service which normalizes the data to make it suitable for search, then publishes the event onto a Kafka topic. These audit events are ingested into ElasticSearch by the Search service making them accessible via the Search UI and Search APIs.
SailPoint’s custom event processing framework adds value by decorating an event with tenant context in the process of publishing the audit event to a multi-tenant Kafka topic. It also captures processing metrics: latency (the amount of time the event waits in the topic before it is processed) and consumer lag (the number of events in the Kafka consumer group waiting to be processed).
Why Was This a Problem?
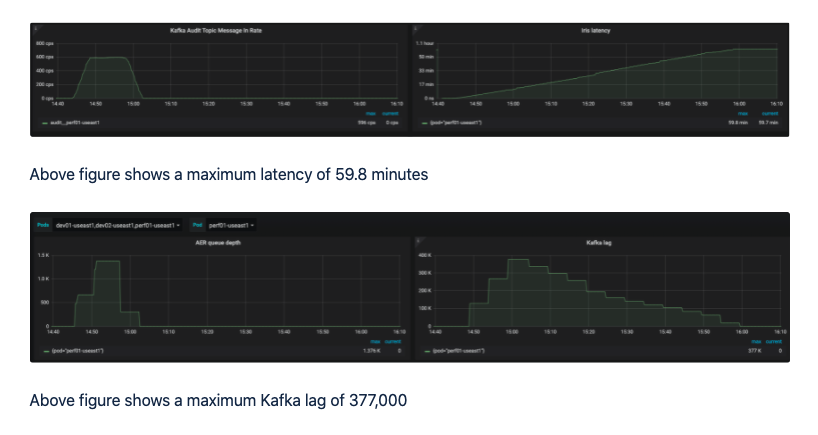
Every morning, millions of audit records were published to the audit Kafka topic in a short period of time. This spike severely impacted the Search service’s ingestion latency and lag, and these delays caused an unpleasant customer experience and an increase in the number of support tickets. The latency, normally measured in seconds, sometimes reached several hours.
What Caused the Latency?
To avoid overwhelming the Elasticsearch cluster, the original Search ingestion engine submitted batches of up to 5MB, waited for Elasticsearch to process them, then processed the results. This would throw exceptions if Elasticsearch errors occurred, during which all ingestion request message threads were blocked. Also, by relying on retry logic to handle error processing, all documents in an ingestion request message were reprocessed when any part of the request failed. This design had a major adverse effect on throughput. In addition to the aforementioned, the framework’s processing of one Kafka event at a time and committing the offset to Kafka only after the ingestion process completed without exception also contributed to the lag.
How Did We Fix It?
Our approach was to process the documents to be ingested using a Kafka Streams application with the following design criteria:
- Process the documents in batches, optimally sized for Elasticsearch ingestion (5MB)
- Submit batches within a minimum period of time so clients do not realize noticeable ingestion delay; this delay could vary based on latency to increase throughput
- Separate document batch processing from batch submission response processing
- Use Kafka Streams-backed state stores to optimize the processing time for each document and to protect against application container failures
- Support batching for documents targeted to different Elasticsearch hosts
- Reprocess individual, failed documents using an incremented delay based on retry count
- Gather comprehensive metrics to support analysis of the state of the ingestion process
- Ensure that older versions of a document do not override newer versions of that document during the ingestion process
Our new ingestion engine is a Kafka Streams application implementation that balances the objective of submitting large batches of documents with the objective of ingesting individual documents quickly.
The process Method
- Invoked for each document in the stream
- Optimized for speed—must process documents faster than the rate at which documents are added to the topic (average process times should be in µs or ms)
- Places documents into the document store based on target host
- Normally does not invoke the submit method (described below) because payload seldom exceeds 5MB
- Kafka topic offsets are managed automatically by the Kafka Streams application (explicit commits in process method destroys performance)
The punctuate method
- Invoked periodically
- The punctuate Interval increases proportionally to latency
- Submits batches for all hosts
- Handles retry processing
The submit method
- Invoked by the process method if the payload exceeds 5 MB, or by the punctuate method
- Builds the batch from action store
- Processes Elasticsearch results, placing individual, failed documents into retry store
Results
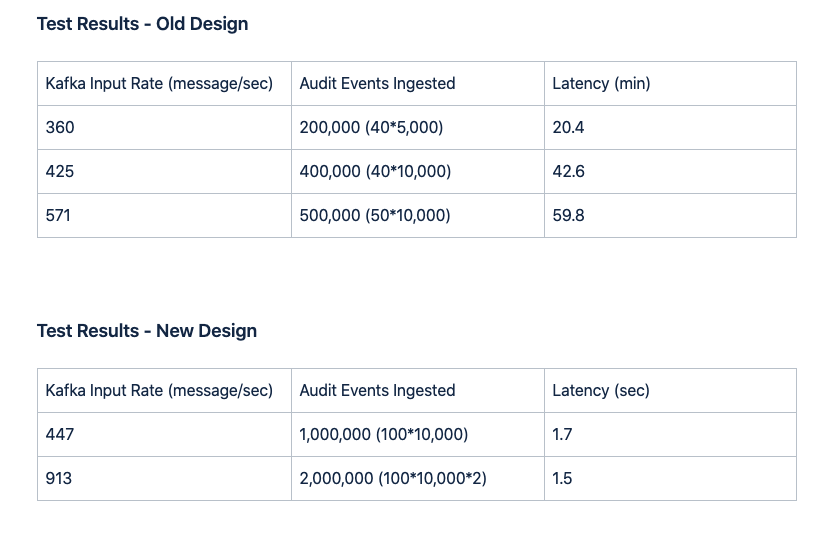
- Average latency under heavy load was reduced from 59.8 minutes to 1.5 seconds
- New metrics (latency, process time & rate, payload size, submit time, error rate, and retry counts) provide real-time visibility into the health and performance of the entire ingestion process and support accurate alerting
- Reductions in the Search service’s resource usage have contributed to significant improvements in service stability
- The new ingestion engine could be easily moved to a separate service to improve search and ingestion scalability
- By reducing the latency to seconds, search results now include new or updated documents almost immediately, meeting our clients’ expectations
Discussion